


Modus frequently reports on investment management at single-family offices, which is becoming more complex and, arguably, should be outsourced more than it is. Including good context in that reporting can be a challenge. Which of the periodic reports about strategic asset allocations at family offices is the best point of reference? Is it the report that surveyed the most offices? The one that collected data most recently? Or the report with the most detailed parsing of their portfolios?
Choosing different family-office reports to reference throughout future Modus newsletters and articles could potentially confuse readers and necessitate repetitive explanations. In an effort to avoid these issues and help everyone better understand how family offices invest, Modus has aggregated data from widely shared and cited reports to create a comprehensive one.
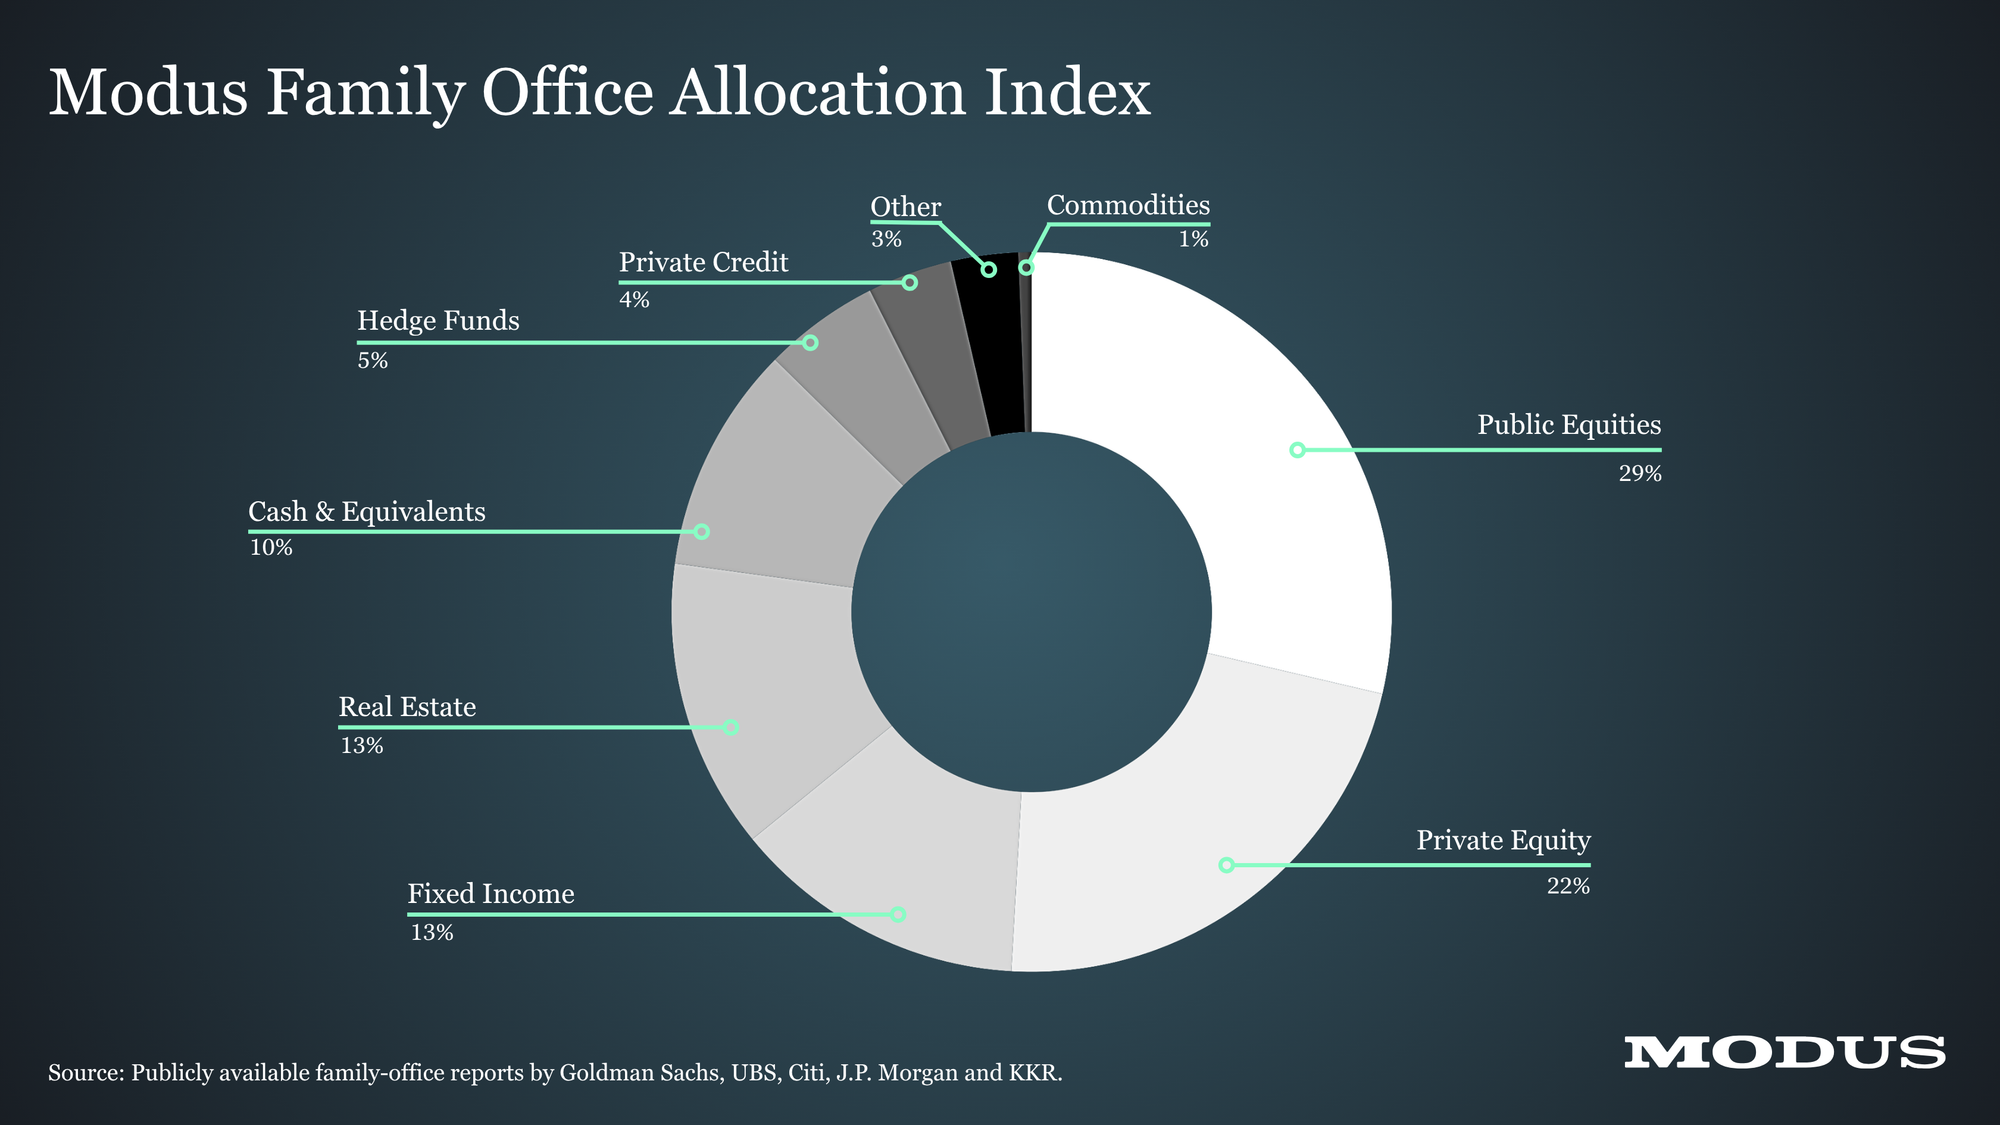
The Modus Family Office Allocation Index represents the average strategic asset allocation across hundreds of large, single-family offices surveyed by five financial services firms. It requires explanation and footnotes, so a full analysis and methodology are provided below.
Modus Family Office Allocation Index Methodology
The Modus Family Office Allocation Index is constructed using analogous data from the most recent family-office reports published by five financial services firms: Goldman Sachs (2025), UBS (2025), Citi (2025), J.P. Morgan (2024) and KKR(2024). These firms survey hundreds of single-family offices that are clients in some capacity. For example, an office might be a client of a company's investment bank, asset management business, private bank, or all three.
Across the five surveys, the average number of participants was 251 and the average family-office investment portfolio was $2.3 billion. On average, 50% of respondents were based in the Americas, 29% were based in Europe, the Middle East or Africa, and 21% were based in the Asia-Pacific region.
Some offices participate in more than one of these surveys, but the extent of overlap is unknown. The descriptions of each report's survey participants suggest that aggregating the results is still worthwhile and that the Modus index has utility. For example, unsurprisingly, a much higher percentage of the UBS survey participants were in Europe.
The surveys are conducted annually, biennially, or less frequently. Some information collected by the surveys can change meaningfully between them. However, like most institutional investors, family offices typically do not make significant changes to their strategic asset allocations on a year-over-year basis. That means data about how much of the portfolios is earmarked for certain asset classes remains relevant one or two years after it is collected.
Many companies survey family offices and publish reports on their findings. Modus chose to use the five reports above because they collected data about a similarly defined group of asset classes. For example, Morgan Stanley's 2025 family-office report is based on a survey of more than 400 respondents, but unlike other reports, it doesn't include data on the average allocation to private credit, an asset class with a growing presence in portfolios. BNY Wealth's 2025 family-office survey specifically asks about allocations to crypto and other digital assets, an asset class that is often lumped into an "other" category by other reports, alongside art, wineries, sports memorabilia and more.
Three important things to remember
Strategic asset allocations might not change significantly year-over-year, but a family office's approach to an asset class can. For example, in Goldman's 2025 report, the average fixed income allocation was 11%, just one percentage point higher than two years ago. But the durations of their securities looked very different than before. In 2023, just 39% of their bonds had an average duration of three to five years. This year, 57% had a duration of three to five years, a sign that offices expect interest rates to be lower in the near future.
And a change of one percentage point (or a few percentage points) in allocation can be major. For example, private credit was absent from most family-office portfolios until recent years; UBS didn't begin surveying offices about it until 2021. This year, offices told UBS their target allocation to private credit was 5%. In dollar terms, that's huge. Today, there are at least several thousand single-family offices globally, and With Intelligence estimates that they collectively manage $4.67 trillion in assets. Out of that pool, an estimated $178 billion is invested in private credit.
With an average investment portfolio of $2.3 billion, the Modus index is a good representation of many family offices, but not the typical one. Most single-family offices are responsible for roughly $250 million in assets. Out of the 3,000 offices analyzed globally by With Intelligence this year, more than 30% reported having between $100 million and $500 million in assets under management.
Why not include other reports? Or other asset classes?
Only analogous data about allocations can be used for the index. That means some reports, which might still be accurate and valuable, don't fit well with the five used for the Modus index.
In the future, the index might include subcategories of asset classes. For example, in the current index, the private-equity allocation includes buyout, growth, venture and others. Another example: Real estate can be broken down into direct investments, fund investments, and fund-of-funds investments.
Have a suggestion?
Like the Modus Family Office Technology Map, the Modus Family Office Allocation Index will continue to evolve and improve. Recommendations for the index are encouraged and should be emailed to Modus Editor Michael Thrasher: michael.thrasher@modus.news.

